

Responsible researcher: Eduarda Miller Figueiredo
Original title: Escalation of Scrutiny: The Gains from Dynamic Enforcement of Environmental Regulations
Authors: Wesley Blundell, Gautam Gowrisankaran and Ashley Langer.
Intervention Location: United States
Sample Size: 107,705 factories
Sector: Environment
Variable of Main Interest: Value of fine and damage caused by pollution
Type of Intervention: Supervision
Methodology: GMM
Summary
The Clean Air Act is legislation to reduce pollution in the United States, in which the US Environmental Protection Agency (EPA) uses dynamic enforcement as a method of accountability in cases of non-compliance with environmental legislation. In other words, the EPA designates repeat offenders as “ high priority violators ” (HPV), exposing them to a high level of prosecution and fines. This article quantifies the gains from dynamic application, also taking into account its benefit in reducing damage caused by pollution. The results demonstrate that dynamic fines are effective in reducing damage caused by pollution.
In the United States, legislation to reduce pollution ( Clean Air Act ) reduced the damage caused by polluted air by US$35.5 trillion from 1970 to 1990. However, this same regulation also had a major impact on all industrial facilities in the country , caused by compliance costs: US$831 billion. Therefore, it is essential to understand the efficiency of regulatory monitoring and inspection mechanisms for pollution control.
The United States Environmental Protection Agency (EPA) [1] uses dynamic enforcement, where regulatory actions are a function of the firm's history of past actions to enforce Clean Air Act (CAA) amendments (Landsberger and Meilijson, 1982; Shimshack, 2014). Specifically, the EPA designates repeat violators as “ high priority violators ” (HPV) [2] , exposing them to a high level of prosecution and fines. Dynamic enforcement can add value when imposing fines is burdensome for the regulator and also when the regulator cannot contract the costs of compliance with regulatory policies.
The work analyzed here seeks to quantify the gains from the dynamic application of CAA, also taking into account its benefit in reducing damage caused by pollution and weighing this against the compliance costs for plants and regulators.
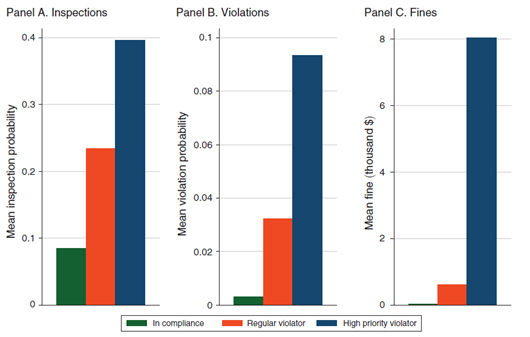
EPA Clean Air Act Enforcement

Source: Blundell et al. (2020).
Figure 1 shows the average inspection rates, violation rates, and fines for compliant factories, regular violators, and “ high priority violators ” (HPVs). In each case, it is clear that the level of scrutiny increases dramatically with HPV status.
The EPA divides the United States into ten geographic regions, where the agency's guidance is that regions and states can take varying approaches to improving state enforcement programs (EPA, 2013). Thus, EPA regions and states represent geographic areas in which federal policy interpretation and enforcement preferences may vary.
The Clean Air Act was passed in 1963 in the United States as an effort to improve air quality. The EPA was created to enforce air pollution standards and other environmental legislation.
The CAA gives EPA the authority to regulate air pollution criteria [3] and several hazardous air pollutants. The CAA primarily requires command and control regulations, which require that pollution from power plants be at or below limits that can be achieved with best technologies and practices. The enforcement regime includes a system of permits, inspections, violations and fines.
All factories – compliant or not – could be inspected regularly. The frequency of these inspections depended not only on differences between states and regions in budgets and execution priorities, but also on the size of the plant and whether the plant was in an area not met by National Ambient Air Quality Standards (NAAQS).[4].
Fines are calculated using two main components: the violating activity and the economic benefit the factory received from the violation (EPA, 1991). The severity component of each violation is determined primarily from the actual or potential harm of the violation: (i) level of violation; (ii) pollutant toxicity; (iii) the sensitivity of the environment into which the pollutant is released; and (iv) the duration of the infringement.
To carry out the research, the following databases were used: (i) Environmental Compliance History Online (ECHO) [5] ; (ii) TEXAS Commission on Environmental Quality (TCEQ) [6] , National Emissions Inventory [7] , ECHO Air Emissions Data [8] , National Ambient Air Quality Standards (NAAQS), AP3 (Clay et al ., 2019). The study was limited to seven most polluting industrial sectors in the North American Industry Classification System (NAICS), which are: mining and quarrying, utilities, manufacturing: food and textiles; manufacturing: wood and petroleum, manufacturing: metal, transportation, educational services. The data covers 107,705 unique factories.
In the dynamic model used for this research, factory decisions are a function of its regulatory state. First, the authors estimate the cost for industrial facilities in accordance with EPA's current dynamic approach. Afterwards, they simulate the value of alternative inspection regimes to affect plant emissions and compliance with the CAA. Furthermore, the authors specified a fixed grid of potential cost parameters and estimated the population weights of each. Finally, they used the Generalized Method of Moments (GMM). From the estimated cost parameters, they evaluated the gains from dynamic enforcement by calculating pollution damage, assessed fines, and other outcomes when plants optimize under counterfactual regulatory policies.
The estimation results demonstrated that investments, inspections, violations, fines and HPV status are costly for factories, with significant effects for investments, fines and HPV status. GMM random coefficient estimates demonstrated that investments equal a $450,000 fine, HPV status equals a $5,600 fine per quarter, and each inspection equals a $37,400 fine.
The authors point out that understanding the absolute magnitude of the coefficients found is complicated by the fact that fines can be more expensive than the value assessed by the EPA. In other words, resolving fines involves additional legal work for the factory and damages its reputation. Therefore, the cost to the factory of a $1 fine may be substantially greater than $1, which in turn implies that if an investment is equivalent to $450,000 in fines, then the cost to the factory will be much more than this value.
It is also shown that 1.9% of factories have a small but negative average investment cost, equivalent to a fine of US$ -20,300 per investment. Where these factories have extremely high costs for inspections (equivalent to a $330,000 fine), violations (a $266,600 fine), and HPV status (a $323,900 fine per quarter), and can be very adverse environmental inspection activities in relation to investment.
By modeling how EPA enforcement activities, investments, overall compliance, and air pollution harm would change under different EPA policies, large increases in factories' share of HPV status and pollution harm are found. In particular, they find that HPV status would increase from 1.4% to 30.8%. However, the investment rate falls only moderately, suggesting that heterogeneity in the types of factories investing and the timing of their investment is important.
Furthermore, given the higher level of plant HPV status, much higher levels of air pollution damage are also found. Damage from air pollutants increases from $1.5 million per factory/quarter to $4 million per factory/quarter. Strong evidence that dynamic fines are effective in reducing damage caused by pollution, depending on the level of fine.
The authors provide evidence that dynamic enforcement is valuable when fines are costly to the regulator: removing dynamic enforcement would increase pollution damage by 164% if fines were held constant. They also demonstrate that increasing the scale of fines with regulatory status would add little additional value.
References
Clay, Karen, Akshaya Jha, Nicholas Muller and Randall Walsh. 2019. “Database for “External Costs of Transporting Petroleum Products: Evidence from Shipments of Crude Oil from North Dakota by Pipelines and Rail.” Data can be accessed from Nicholas Muller, https://public.tepper.cmu.edu/nmuller/APModel.aspx .
Environmental Protection Agency (EPA). 1991. “Clean Air Act Stationary Source Civil Penalty Policy.” Washington, DC: EPA.
Environmental Protection Agency (EPA). 2013. “National Strategy for Improving Oversight of State Enforcement Performance.” Washington, DC: EPA.
Landsberger, Michal, and Isaac Meilijson. 1982. “Incentive Generating State Dependent Penalty System: The Case of Income Tax Evasion.” Journal of Public Economics 19 (3): 333-52.
Shimshack, Jay P. 2014. “The Economics of Environmental Monitoring and Enforcement.” Annual Review of Resource Economics 6: 339-60.
[1] US Environmental Protection Agency (EPA).
[2] High Priority Violator (HPV).
[3] Ozone ( ), particulate matter (PM), carbon monoxide (CO), nitrogen oxides (
), sulfur dioxide (
) and lead (Pb).
[4] National Ambient Air Quality Standards (NAAQS).
[5] Environmental Compliance History Online (ECHO).
[6] Texas Commission on Environmental Quality (TCEQ).
[7] National Emissions Inventory.
[8] ECHO's Air Emissions.